1. What happened this week
The Baltic came first. On 1 September the port of Ust-Luga was attacked for the second time within three weeks. The governor said air defences had brought down 52 drones, and a fire at the port was out by 9:30 Moscow time (The Moscow Times, 1 September 2026).
On 2 September the Panama Canal Authority lowered the permitted draft for the largest vessels to 14.63 metres, and a day later cut daily transits from 36 to 34. The reason was the low water level in Gatun Lake (The Rio Times, September 2026).
On 3 September the argument over how many ships still pass the Strait of Hormuz broke into the open. US officials spoke of up to 40 a day, the data provider Kpler counted 5 to 11, and Lloyd’s List around 12 (Al Jazeera, 3 September 2026).
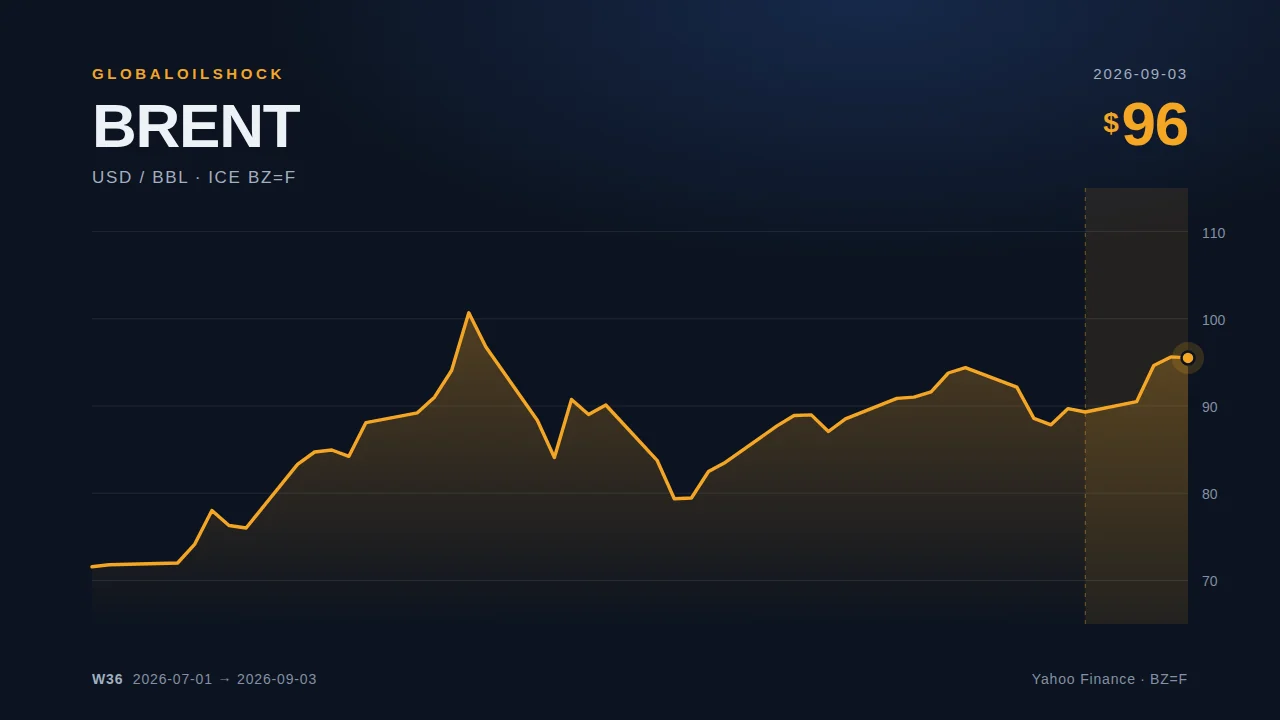
Across the week the futures contract on Brent rose from USD 89.70 to USD 95.52 (Yahoo Finance, BZ=F, daily close).
2. Three sources, three figures: how they fit together
A spread between 5 and 40 ships a day is too wide to be a matter of measurement error. It exists because the three sources are counting different things by different methods.
Kpler and providers like it read AIS signals, the position reports that ships broadcast themselves. In a risk area a great many vessels switch those off. An AIS based count therefore gives a floor, not the traffic that is actually there.
Lloyd’s List adds port records and broker information to the ship data, which is why it arrives at a somewhat higher number.
The figure from the US side refers, according to the report, to escorted transits in convoys, a procedure the Americans run themselves and therefore know in full. That same side also has an interest in presenting the strait as usable.
In cases of this kind we name every figure with its source rather than pick one of them. Rely on a single count and the picture comes out either too calm or too dramatic.
3. Freight rates: the surcharge the oil price does not carry
Chartering a supertanker from the Persian Gulf to China cost around USD 704,000 a day this week. On 5 September 2025 the same route cost USD 53,783 (Baltic Exchange, route TD3C). That is roughly thirteen times as much.
Insurance comes on top. War risk cover for high risk voyages runs at 7.5 to 10 percent of the vessel's value, against around 0.25 percent before the war (AXS Marine, weekly report, week 35/2026).
Put together, the two explain a number that appeared in the Oil Market Report of the International Energy Agency this week. Diesel in US wholesale cost more than USD 200 per barrel in early September, which is over USD 1.25 per litre before tax and 94 percent more than before the war (IEA Oil Market Report, September 2026). The futures contract on crude stood about 30 percent above the pre-war level over the same period.
Anyone looking for the reason consumer prices outrun the quoted oil price will find it in that gap, and not in the raw material.
4. Panama: a crisis with nothing to do with the war
One item in this review has a cause unlike all the others. The canal runs on fresh water from Gatun Lake, and every lockage uses a considerable amount of it. When the level drops, the authority can either let fewer ships through or reduce the draft it allows. This week it did both.
For the oil market the canal counts mainly as the route for liquefied gas and for products leaving the US Gulf Coast for Asia. Narrow it, and those cargoes go around Cape Horn or through the Suez Canal instead, and both of those are longer or dearer than usual just now.
The case is a good argument for separating causes, which is what we do in our monitoring of the shipping routes. A drought is not an attack. It works just as well. The classification of this point is recorded there with its date and its source.
5. What this means for households in Europe
The four countries pulled apart this week. Germany went to EUR 1,401.80 per 1,000 litres on 31 August, 5.2 percent more than a week earlier, while Austria fell to EUR 1,607.10 (down 1.7 percent), France to EUR 1,672.40 (down 3.0 percent) and Spain to EUR 1,322.70 (down 1.9 percent). All figures from the EU Oil Bulletin, as of 31 August 2026.
That needs explaining, because the commodity price rose by the same amount for all four. The German reading of the previous week had been unusually low, and this increase makes up the difference. In Austria and France the previous week had brought the highest level since the crisis began, and a pullback followed.
A single country in a single week is therefore a thin basis for anything. The line across several weeks says more, and in all four countries it points upwards. The weekly figures are on our heating oil price map.