Friday morning, Rotterdam, an illustrative example, not current prices. A refinery manager opens Bloomberg. Brent at 85 USD/bbl. RBOB gasoline (US standard) at 2.50 USD/gallon = ~105 USD/bbl. ULSD heating oil at 2.80 USD/gallon = ~118 USD/bbl.
The calculation: (2 × 10⁵ + 1 × 118) − (3 × 85) = (210 + 118) − 255 = 328 − 255 = 73 USD per 3 barrels crude input. Per barrel: 73 ÷ 3 = 24.33 USD/bbl crack-spread. That's wide vs. normal (12 USD typical). The refinery prints money.
But wait: The refinery also needs electricity, steam, chemicals (costs: ~3–5 USD/bbl). Net profit: ~20 USD/bbl on this trade. For current crack-spread values, see the EIA's published product price series.
That's the crack-spread: not abstract, but concrete, how much does a refinery earn when it buys crude and sells fuel+heating oil?
Definition: How a refinery makes money
A typical refinery splits crude oil into these fractions:
- Light fractions: Gasoline (40–45%), Kerosene/Jet fuel (10–15%), LPG (3–5%)
- Heavy fractions: Diesel/Heating oil (30–35%), Fuel oil (5–10%), Bitumen (2–3%)
The crack-spread measures: sales revenue (gasoline + heating oil) minus crude cost. Not all products are equally profitable. The 3-2-1 focuses on the top 2 products.
Why 3-2-1? Because it's typical: 3 barrels of WTI crude become roughly 2 barrels of RBOB gasoline + 1 barrel of ULSD heating oil. These are the liquid futures NYMEX trades. Other spreads exist: 5-3-2 (more realistic, but less liquid), 2-1-1 (even more realistic for some refineries).
Key: The crack is a MARGIN indicator, not a price. A wide crack means refining is very profitable. A tight crack means refining barely breaks even.
Crack-spread history: Structural patterns
The crack-spread fluctuates seasonally and cyclically:
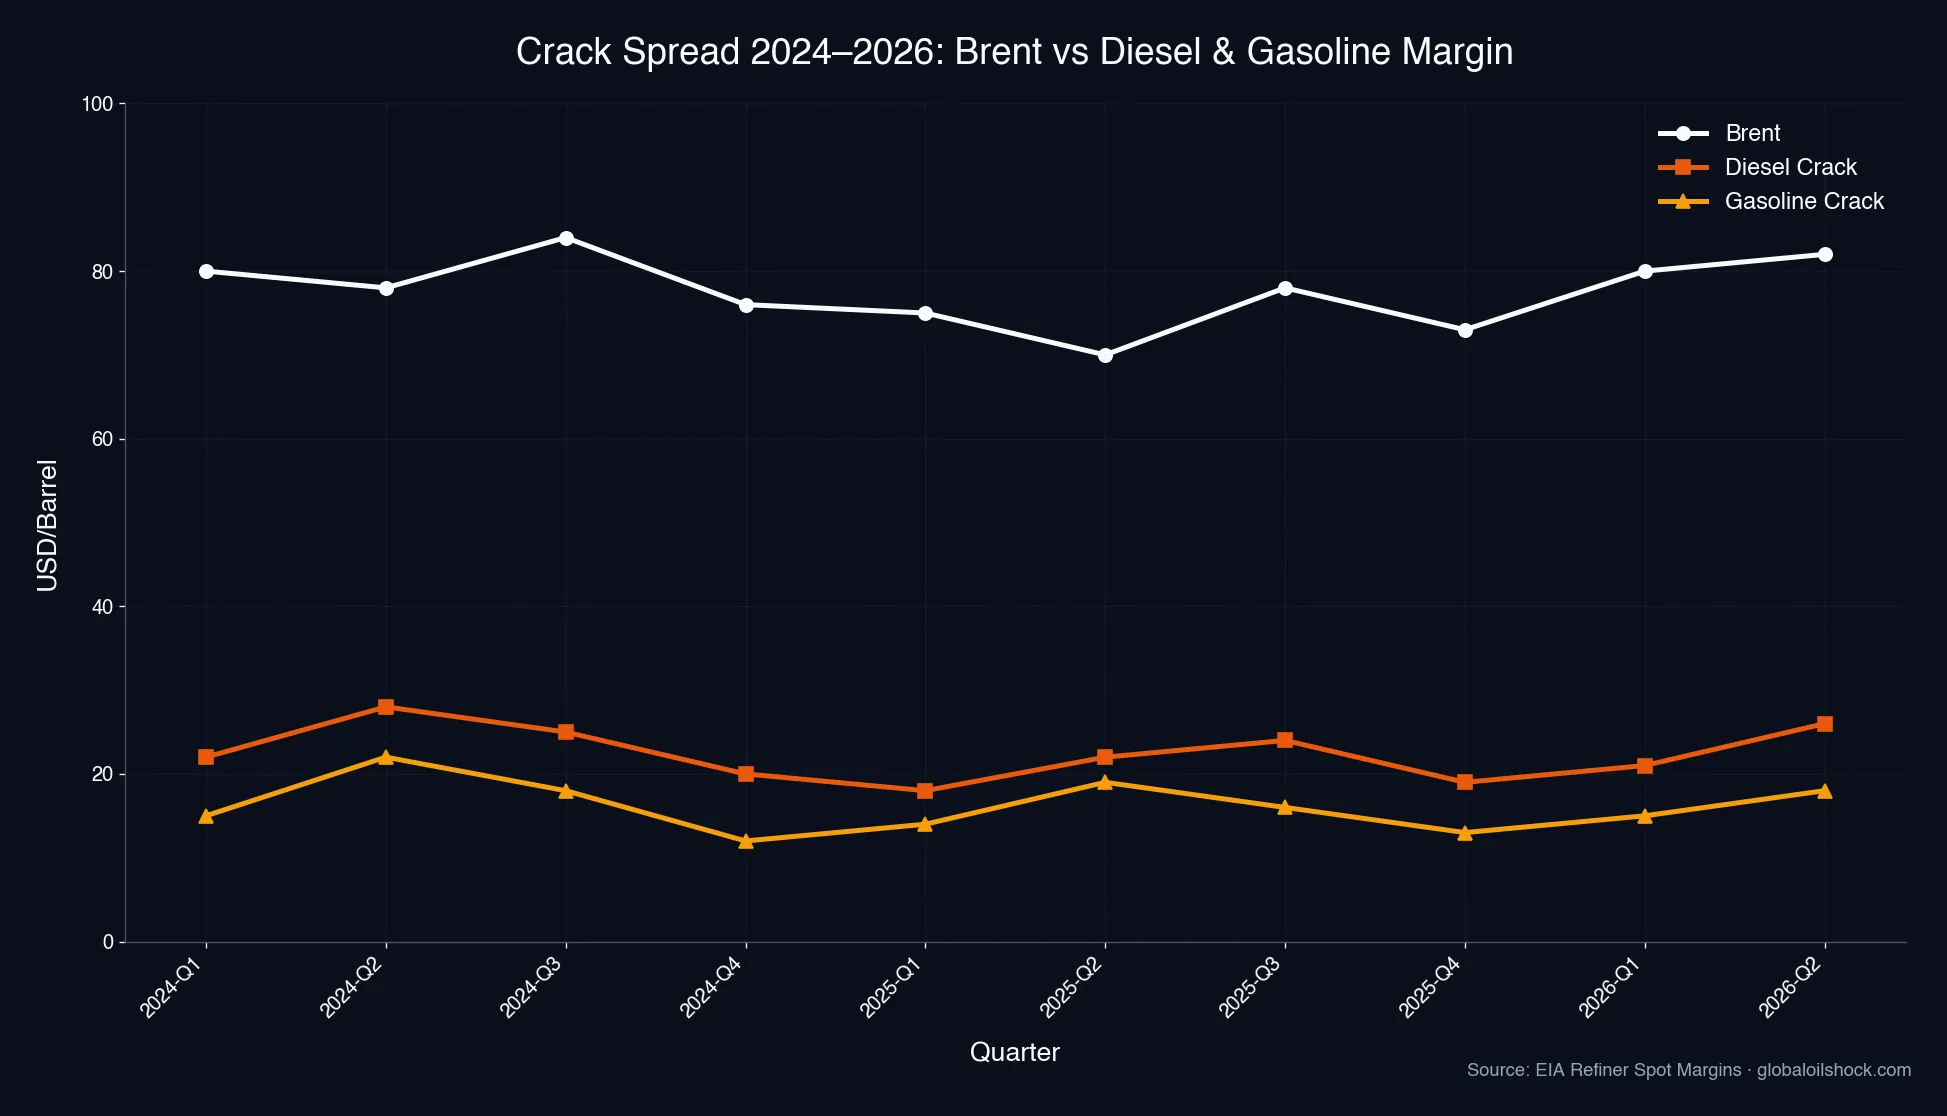
Baseline (2010–2021 average): 10–16 USD/bbl. Refineries earn modest but steady margins. Capacity runs at 85–90%.
2022 Energy Crisis: Russian crude offline, supply chains chaotic, gasoline demand spikes. Crack-spread explodes to 50–60 USD/bbl in spring 2022. Pump prices follow 4–6 weeks later. Households pay 2.00 EUR/L+. Refineries: wealthiest ever.
2023–2024 Normalization: Cracks narrow back to 15–25 USD/bbl. Production runs steady, demand cools, China lockdown ends gradually.
Seasonal: Spring (March–April): Gasoline crack widens (driving season prep). Fall (Sept–Oct): Heating-oil crack widens (heating season prep). Winter/summer: Cracks tend tighter.
Regional: Brent-crack vs. WTI-crack differ by 2–5 USD/bbl (Northwest Europe vs. US Gulf Coast have different product mix and logistics).
Crack-spread mechanics: Input-output arithmetic
The 3-2-1 crack-spread is quoted daily on NYMEX futures. A trader or refinery can hedge it:
Strategy: Long crack (speculator expects wide cracks)
- Buy 3 WTI futures (hedge crude purchase)
- Sell 2 RBOB gasoline futures
- Sell 1 ULSD heating-oil futures
If the crack widens from 15 to 20 USD/bbl, the speculator profits. Refineries use this trade to lock in margin.
Why doesn't the crack close the loop? Because crack-spread depends not just on crude and products, but also on:
- Refinery capacity (at 100% utilization, costs spike)
- Sweet vs. sour crude availability (heavy sour crude is cheaper but needs specialized refineries)
- Logistics costs (transport crude to refinery, products to pump)
- Environmental regulations (force refineries to invest in tech, raising costs)
What wide and tight cracks mean for your wallet
Scenario A: Wide crack (35 USD/bbl in April)
What happens:
- Weeks 0–1: Refineries ramp capacity. Output rises. Initially no price pressure (wide crack = good margin, not oversupply).
- Weeks 2–4: Gasoline and heating-oil supply rises. If demand flat or declining (spring = less heating-oil needed), oversupply pushes prices down.
- But: Wide cracks often arise because crude is CHEAP relative to products. Meaning: crude price just fell, or product prices are high (scarcity).
- Paradox: Wide crack = low input costs + high output prices → your pump costs are HIGH NOW, but may fall soon (if crack arbitrage ramps capacity).
Scenario B: Tight crack (8 USD/bbl in February)
- Weeks 0–1: Refineries cut capacity. Not worth refining.
- Weeks 2–4: Product supply falls. Scarcity drives pump prices up, even though crude didn't get more expensive.
- Timing: Tight crack is often a red flag for pump-price spikes in 4–8 weeks (because production drops, not because crude gets dear).
Action: Monitor crack-spreads for price timing
- Check EIA weekly reports: The U.S. Energy Information Administration publishes every Wednesday product inventory and production. If gasoline stocks falling = production down = crack was tight. Pump price will follow 3–5 weeks later.
- Watch NYMEX crack futures (observe, don't trade): Bloomberg, CNBC, or IEA reports show current 3-2-1 levels. If 3-2-1 jumps from 12 to 25+ USD/bbl within days, it's a scarcity warning → fuel will be expensive 4–6 weeks out.
- Contrarian thinking: Wide cracks often emerge in oversupply phases (crude cheap, products normal). This can be a contrarian buy: speculators will soon short the cracks, refineries cut capacity, prices then rise. But timing is hard.
- Use seasonality: March: Gasoline cracks widen (driving-season prep). September: Heating-oil cracks widen (heating-season prep). If either month collides with geopolitics (e.g., Iran sanctions risk), crack explodes. Then 6 weeks of high pump prices are near-certain.