
A futures curve is not just a single price. It is a time series: spot price (today), 1-month contract, 3-month contract, 6-month contract, 12-month contract.
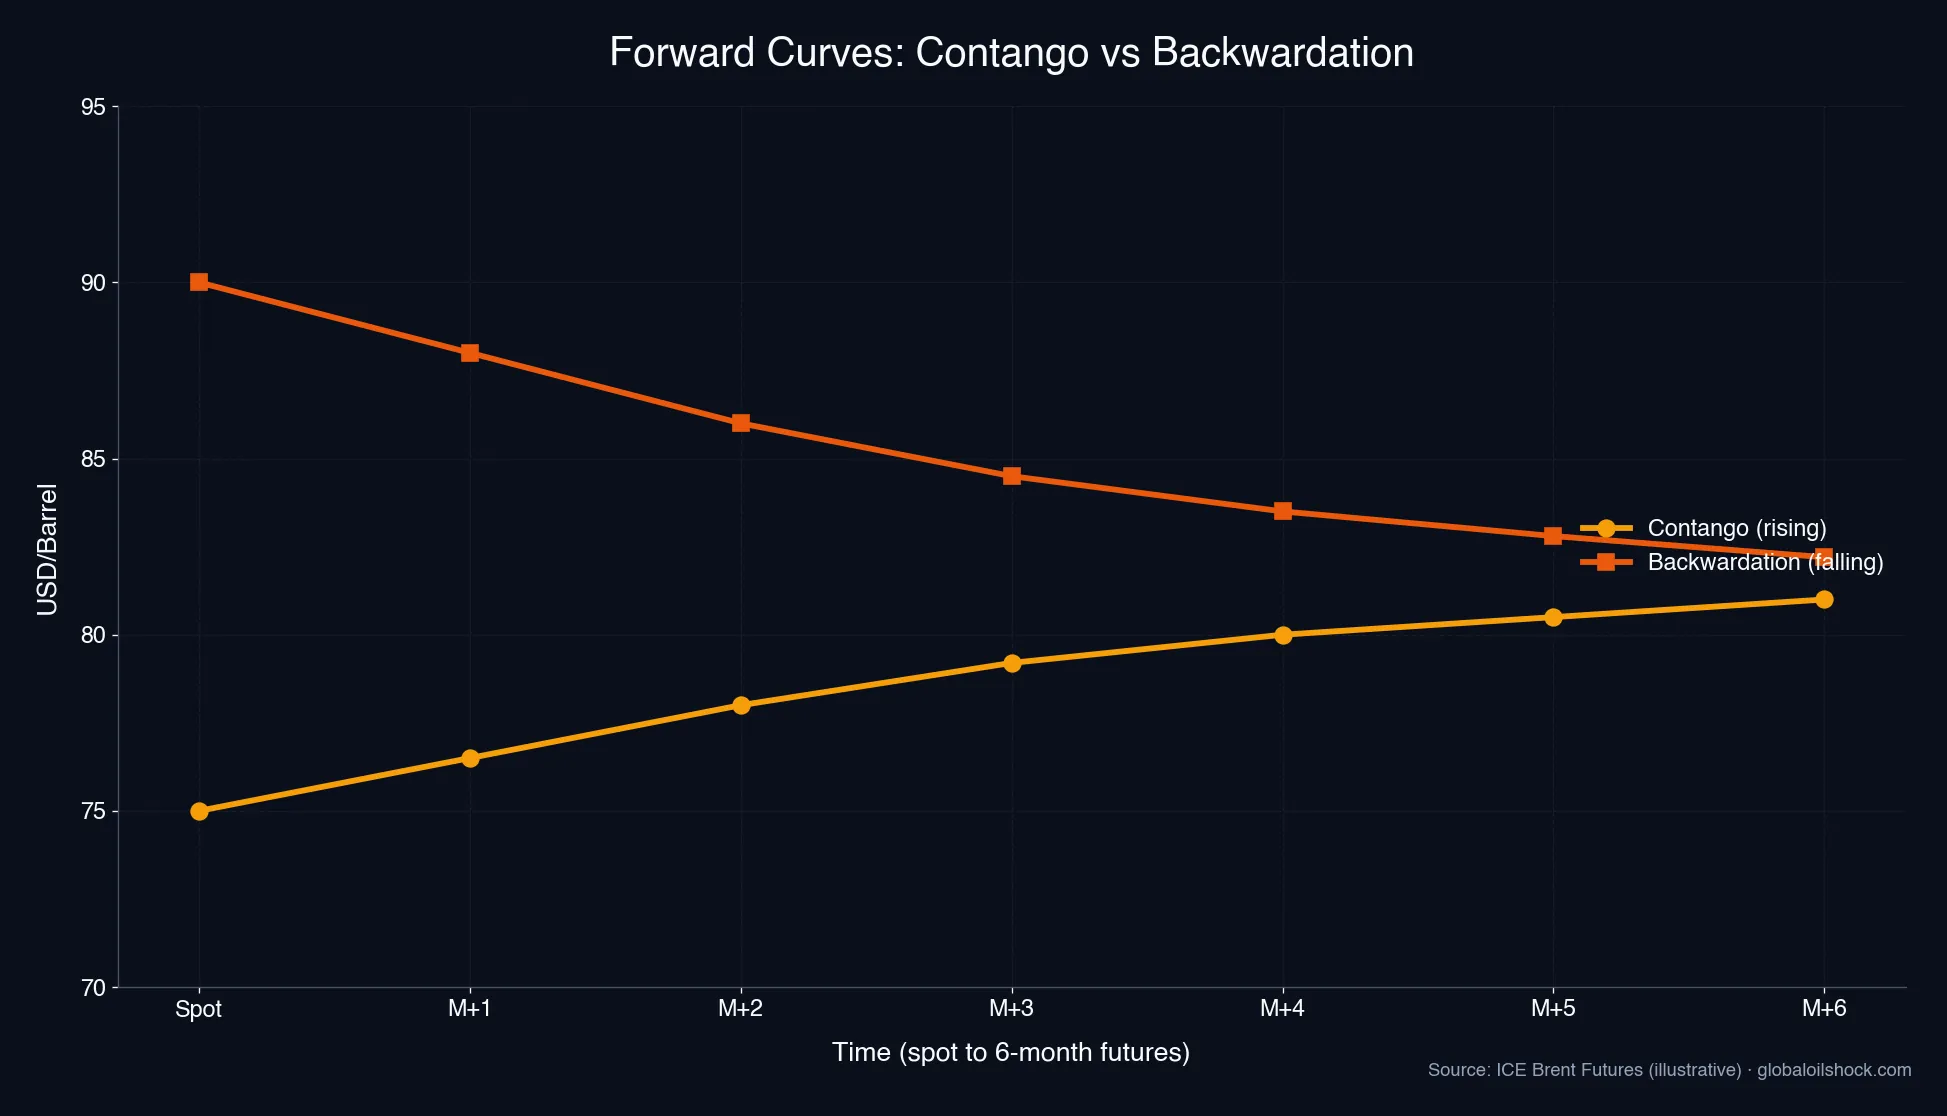
Definition: Contango vs. Backwardation on the Price Axis
CONTANGO (upward sloping curve): The curve rises to the right. Example Brent January 2024: Spot 75 USD/bbl, 1M 76 USD, 3M 77.50 USD, 6M 78 USD, 12M 78.50 USD. Prices increase over time. That is contango. Economically this means: storage is attractive. A speculator can buy oil today (75 USD), store it (costs 0.50–1.50 USD/month), and sell it in 6 months for 78 USD. Profit: 2–3 USD minus storage = 0.50–2 USD/bbl, a profitable trade.
BACKWARDATION (downward sloping curve): The curve falls to the right. Example Brent October 2022 (post-Russia invasion): Spot 95 USD/bbl, 1M 92 USD, 3M 88 USD, 6M 83 USD, 12M 75 USD. Prices decline over time. That is backwardation. Economically this means: immediate scarcity. The spot price is high because oil is needed NOW. Future oil is cheaper because the shortage is expected to ease. Storage is NOT profitable, you pay 95 USD, store it, and get less later. Buyers pay a scarcity premium TODAY.
Historical Examples: 2020 Super-Contango, 2022 Backwardation
April 2020, COVID crash, super-contango record. Lockdown: refineries cut runs, storage full, demand in freefall. Massive oversupply. WTI front-month (May): −37 USD (yes, NEGATIVE, sellers paid to offload oil). WTI 12-month contract: +20 USD. Spread: 57 USD per barrel! Result: speculators chartered oil tankers (VLCCs), bought oil at −37 USD, loaded it, anchored the tankers offshore, and waited. After 4–6 months they sold the oil at higher prices. Floating storage became an arbitrage play. Heating oil side: prices CRASHED April–May 2020. Super-contango signaled oversupply and falling prices.
October–December 2022, Russia invasion, deep backwardation. Europe banned Russian oil. Brent supply tight, especially front-end. Strong physical demand. Brent spot: 95 USD/bbl, Brent 1M: 90 USD, Brent 6M: 80 USD. Front-6M spread: −15 USD (deep backwardation). Result: refineries ran FLAT OUT. Storage was NOT profitable. Heating oil prices SOARED due to spot premium.
Why Curve Shape Matters, Storage Economics
Curve shape depends on storage costs: 0.50–2 USD/bbl/month. In contango the spread MUST exceed storage costs for arbitrage to be profitable. In backwardation there is NO spread to offset. That is the signal: oil is TIGHT RIGHT NOW.